Statistical Movement of Living

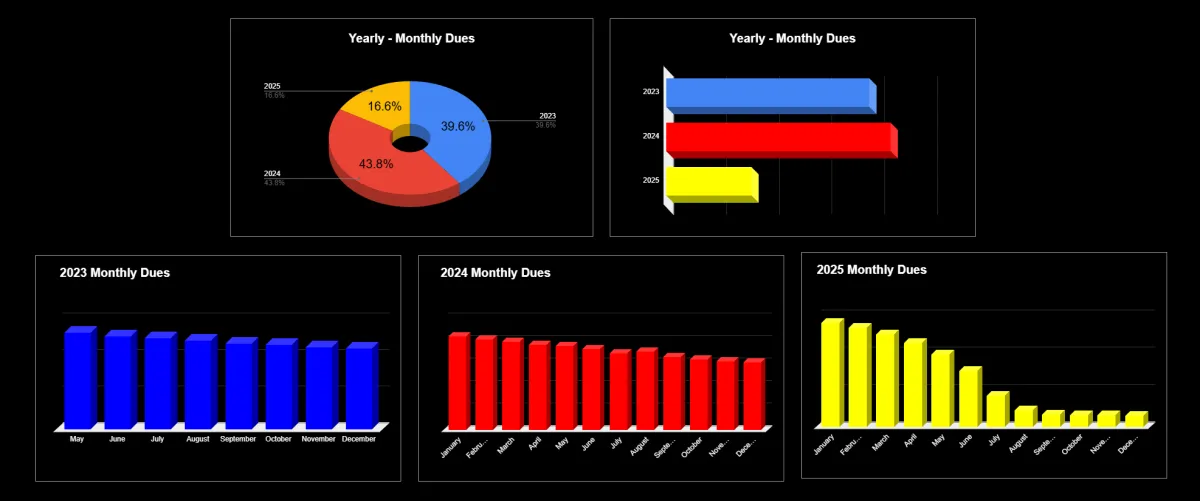
A year-by-year record showing the percentage of homeowners residing in our subdivision from 2023 to 2025.

This statistical report on the movement of homeowners from 2023 to 2025 provides valuable insight into the growth and development of our subdivision. By understanding the trends in occupancy, community leaders and developers can make informed decisions regarding resource allocation, infrastructure planning, and community services. It helps identify periods of rapid growth or decline, allowing for timely improvements in housing, utilities, and security.

This data also encourages TRANSPARENCY and helps build trust among residents by showing a clear record of progress. Ultimately, it serves as a vital tool for ensuring a well-managed, responsive, and thriving community for all homeowners.

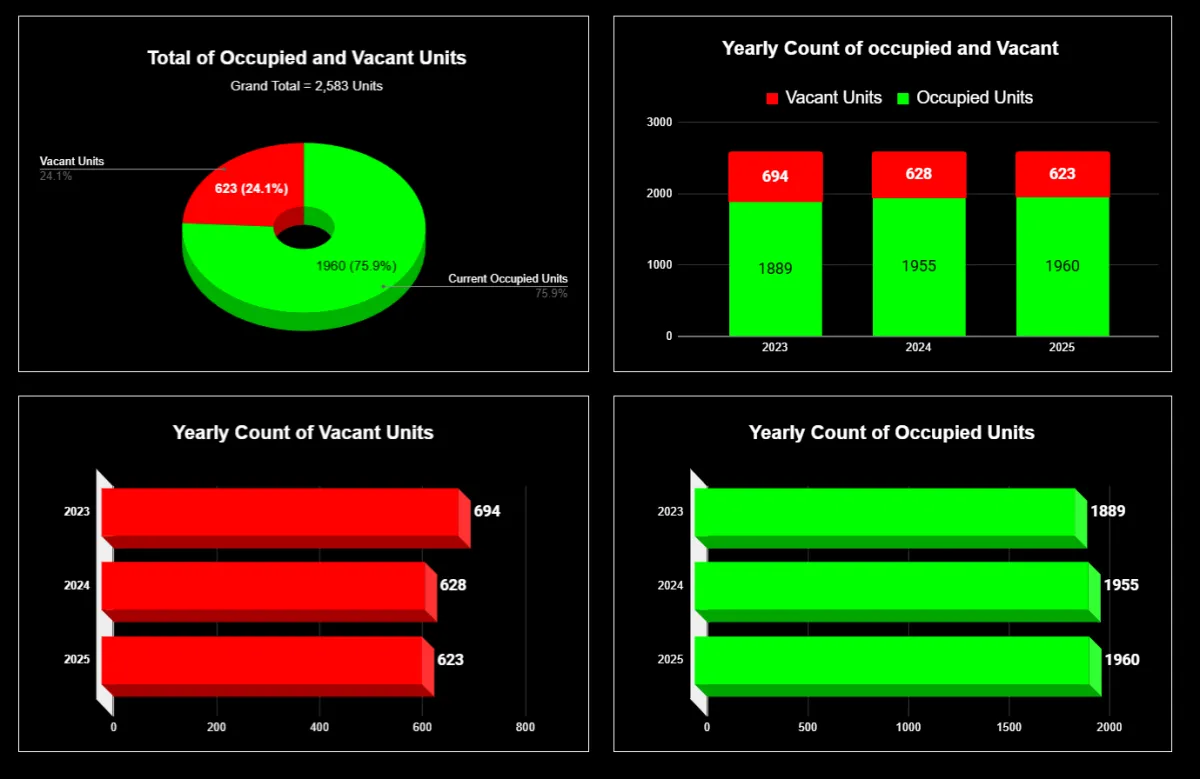
The Count of Occupied and Vacant Units offers helpful insights through range, frequency, and percentage, aiding in community planning and management. However, it may not fully represent actual occupancy, as units with unpaid Monthly Dues may be excluded. Despite this, it remains a valuable tool for monitoring housing trends. (Data from May 01, 2023 to July 20, 2025)

The Monthly Dues data presents a clear view of payment trends using range, frequency, or percentage. This helps visualize financial participation across the community, offering valuable insights for budgeting, planning, and ensuring sustainability. It supports transparency and encourages timely contributions for the benefit of all homeowners and services.
(Data from May 01, 2023 to July 20, 2025)

Above visualization and analysis is being produce by the below HOA Officer

PNE HOA Board of Director | Treasurer | Security and Safety Committee Head

Copyright 2025. All rights reserved

Developed by: ljsystemservices.com | Jun Tadigon